
As part of managing your Firebase projects, you'll want to review the resource usage of your Realtime Database (for example, how many users are connected, how much storage your database uses) and how that usage is affecting your bill.
To review your Realtime Database billed usage, check the Usage and Billing dashboard. For more information about billing, see Understand Realtime Database billing.
For resource usage, both the Usage tab in the Firebase console and the metrics available through Cloud Monitoring can help you monitor Realtime Database usage.
Receive Firebase alerts
You can choose to receive email alerts when your Realtime Database usage is approaching one of the limits for your pricing plan. By default, Firebase sends email alerts when you've reached or exceeded a plan limit, but you can opt-in to these earlier notifications to adjust your plan or usage and avoid any service disruptions.
These Firebase alerts and their settings are project-wide. This means that, by default, every project member with the required permissions to receive alerts will get an email when a Realtime Database alert is triggered. Emails are sent to individual email addresses (not to groupings of accounts like Google groups or Google Workspace accounts).
Turn on/off alerts for your own account
For your own account, you can turn on/off Realtime Database alerts without affecting other project members. Note that you still need the required permissions to receive alerts.
To turn Realtime Database alerts on or off, follow these steps:
- In the Firebase console, in the top right-corner, go to
Firebase alerts . - Then, go to
Settings and set your account preference for Realtime Database alerts.
Monitor usage in the Firebase console
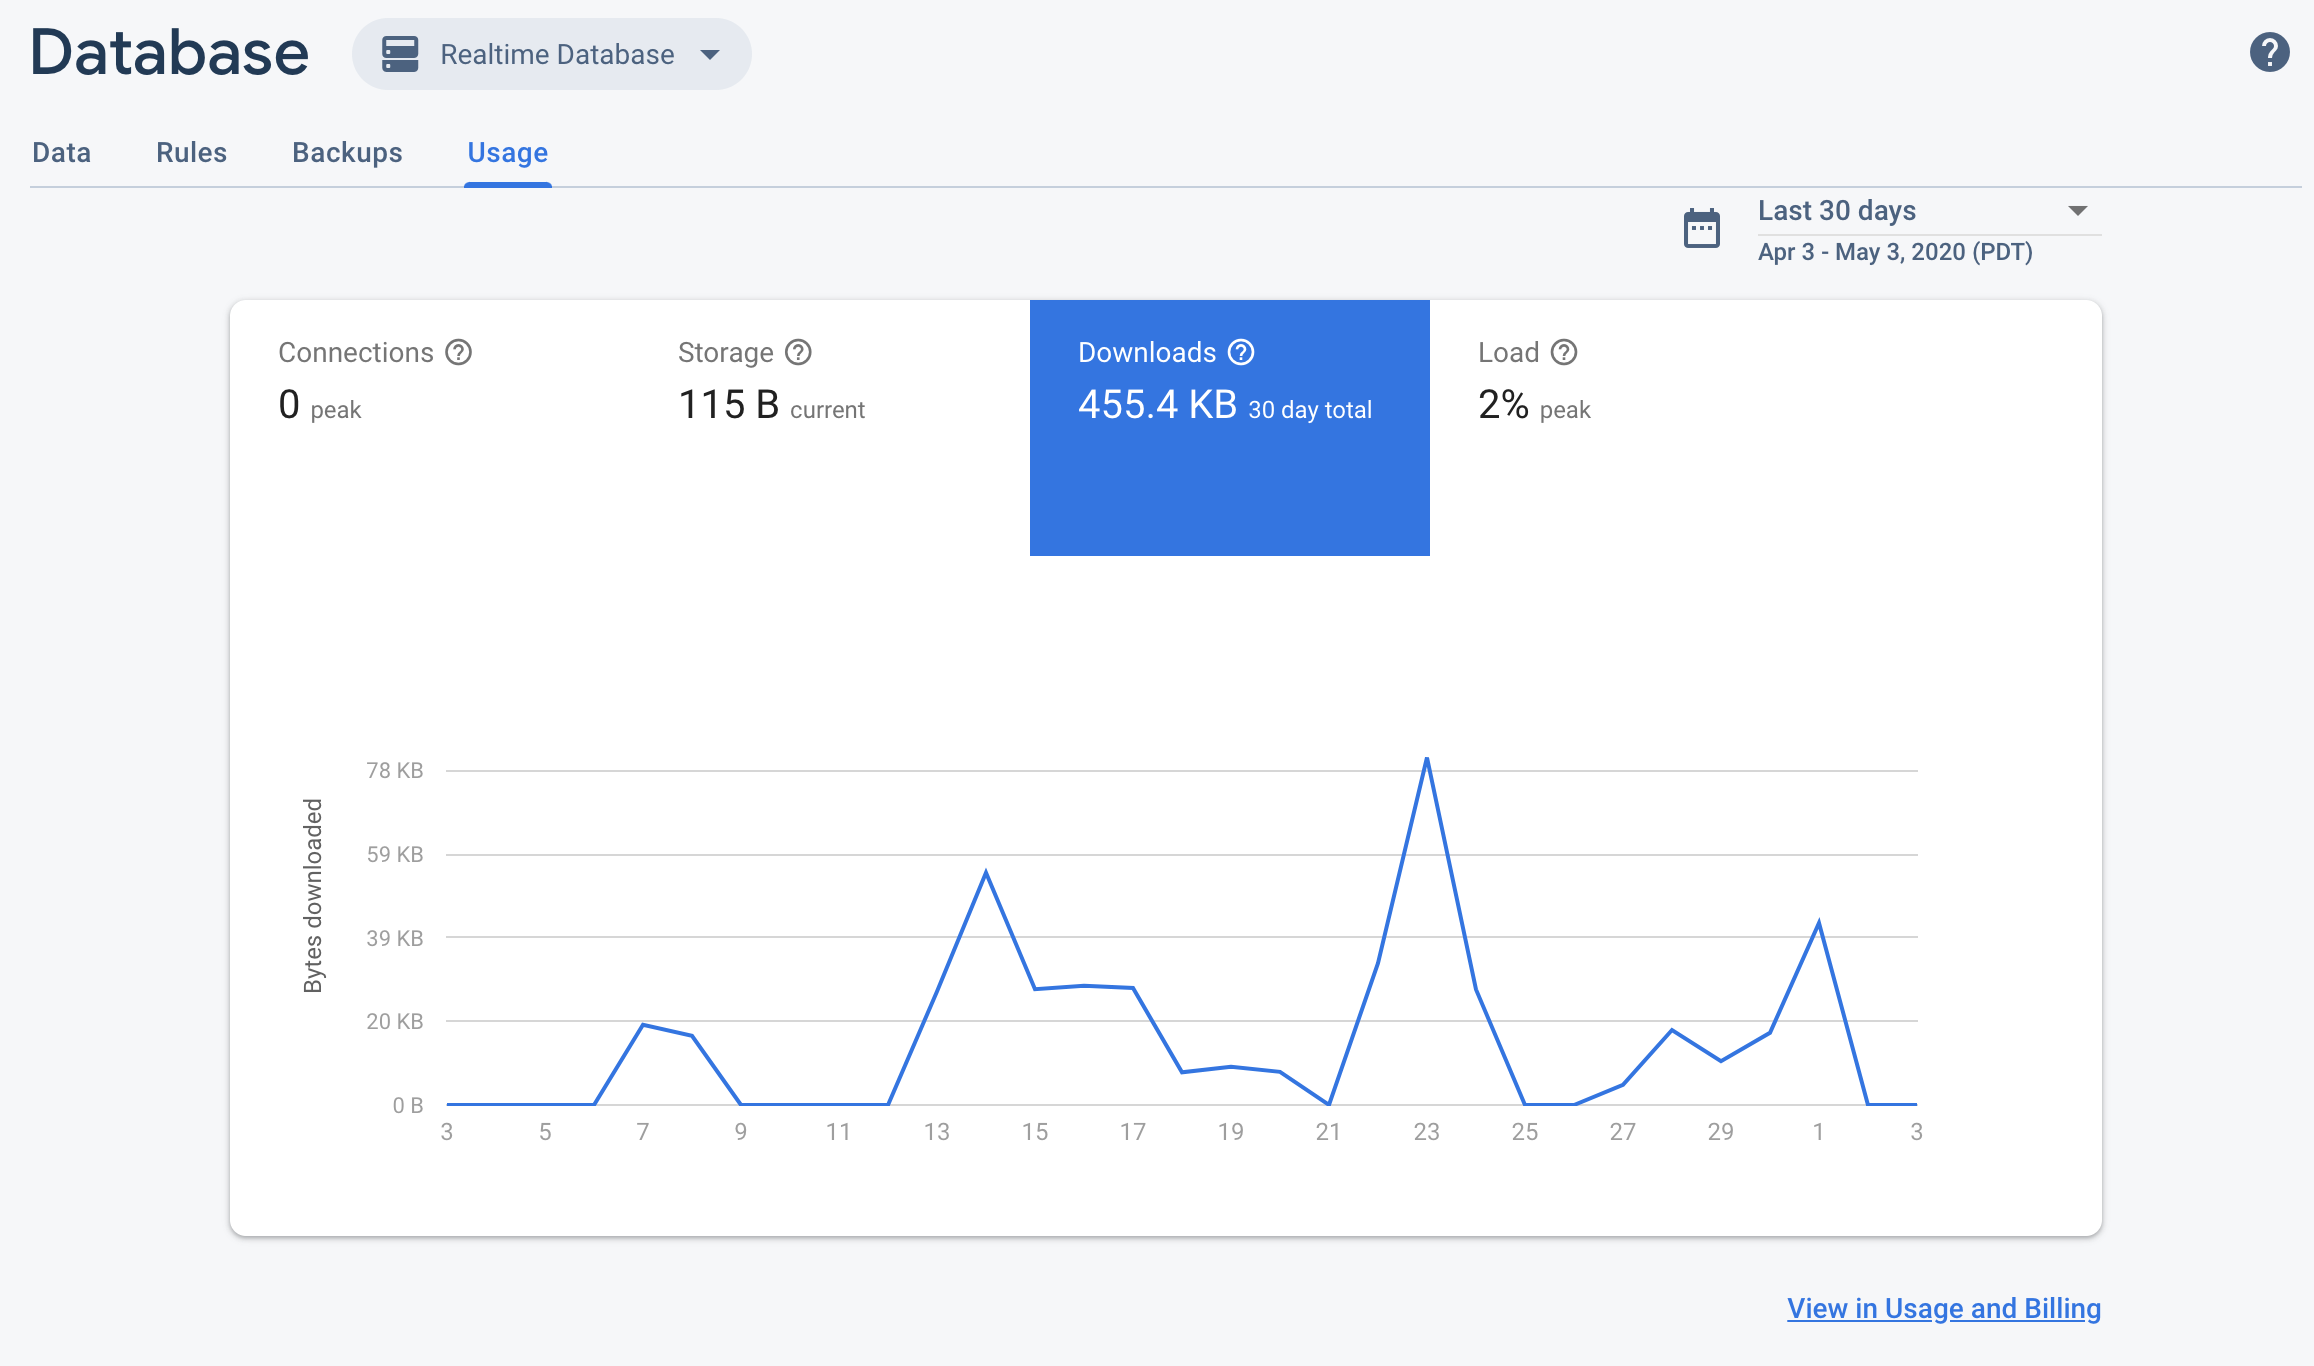
To see your current Realtime Database connections and data usage, check the Usage tab in the Firebase console. You can check usage over the current billing period, the last 30 days, or the last 24 hours.
Firebase shows usage statistics for the following metrics:
- Connections: The number of simultaneous, currently open, realtime connections to your database. This includes the following realtime connections: WebSocket, long polling, and HTML server-sent events. It does not include RESTful requests.
- Storage: How much data is stored in your database. This doesn't include Firebase hosting or data stored through other Firebase products.
- Downloads: All bytes downloaded from your database, including protocol and encryption overhead.
- Load: This graph shows how much of your database is in use, processing requests, over a given 1-minute interval. You might see performance issues as your database approaches 100%.
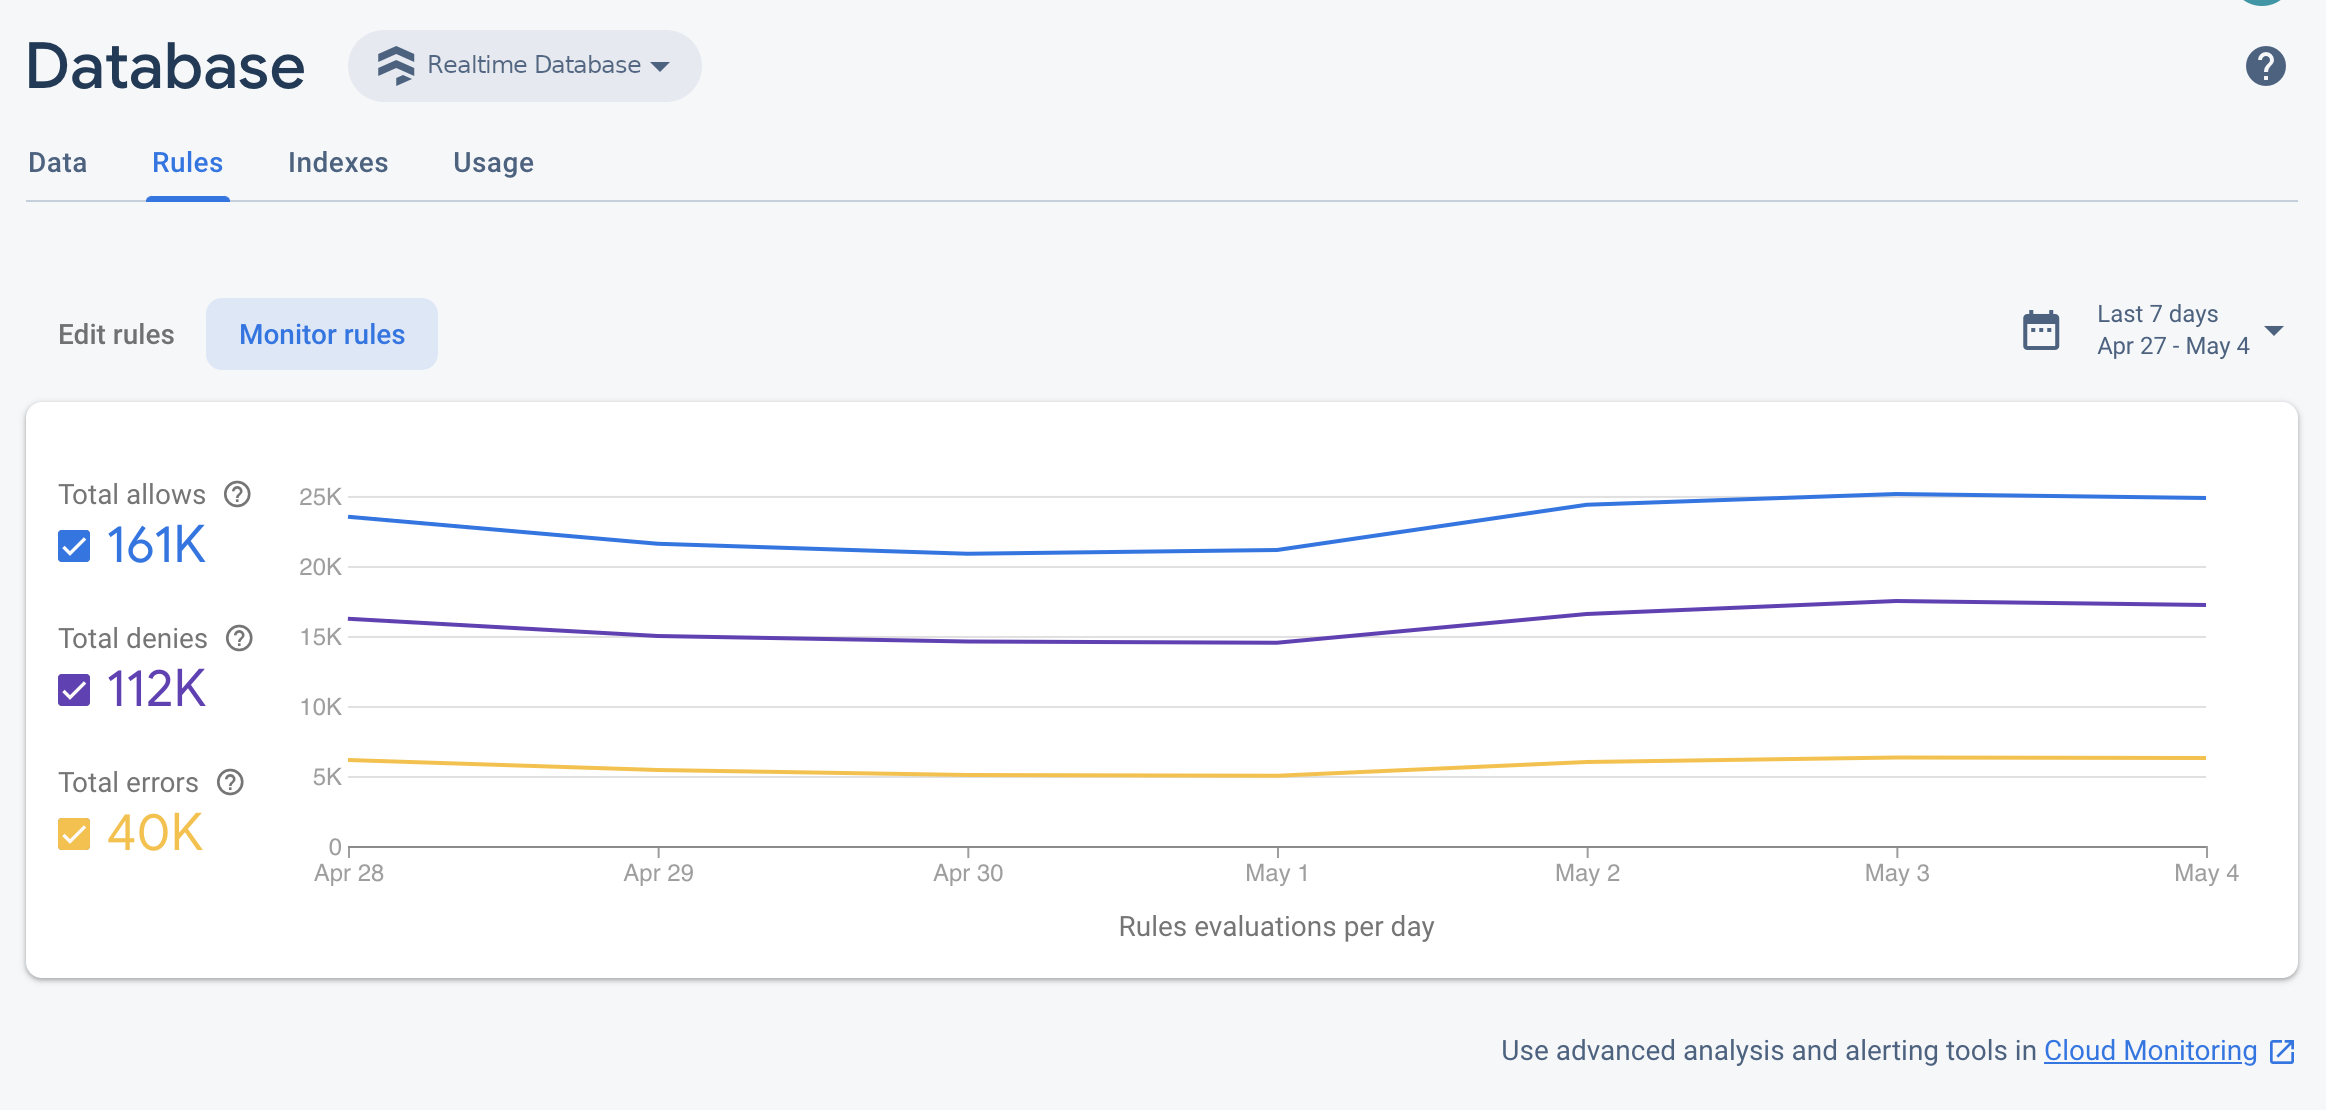
Additionally, the Firebase console provides a Firebase Security Rules evaluation dashboard, a useful, at-a-glance view of rules invocations. You can also monitor Firebase Security Rules usage through Cloud Monitoring. This provides the same rule evaluation metrics, along with the ability to build custom dashboards, analyze trends, and configure alerts (for example, when denied requests spike). See the Cloud Monitoring metrics reference for the complete list of available metrics.
For more information see Monitor Security Rules in Cloud Monitoring.
Monitor usage with Cloud Monitoring
Usage metrics
To use Cloud Monitoring to monitor your billed usage, track the following
metrics. Note all metric type names are prefixed with firebasedatabase.googleapis.com/.
| Metric Name | Description |
|---|---|
| Sent Payload Byte Count |
|
| Sent Payload and Protocol Bytes Count |
|
| Sent Bytes Count | network/sent_bytes_count. This metric reflects an estimate of the total
size of data sent out from your database through reads. It includes the
payload data that is actually sent to clients, in addition to the protocol and
encryption overhead that results in connection costs. This most accurately
reflects the total outgoing bandwidth on your Realtime Database bill.
|
| Total Bytes |
|
Combine metrics in charts on your dashboard for helpful insights and overviews. For example, try the following combinations:
- Outgoing data: Use the
network/sent_bytes_count,network/sent_payload_and_protocol_bytes_count, andnetwork/sent_payload_bytes_countmetrics to spot potential issues with protocol or encryption overhead contributing to unexpected costs on your bill. If you see a large discrepancy between the size of the data payloads requested and the other metrics reflecting connection overhead, you might want to troubleshoot issues that might be leading to timeouts or frequent connections. If you're not using TLS session tickets, you might try implementing them to reduce SSL connection overhead for resumed connections. - Operations: Use the
io/database_loadmetric to see how much of your total database load is used by each operation type. Make sure to groupio/database_loadby type to troubleshoot different operation types. - Storage: Use the
storage/limitandstorage/total_bytesto monitor your storage utilization in relation to the Realtime Database storage limits.
See the full list of Realtime Database metrics available through Cloud Monitoring.
Create a Cloud Monitoring workspace
To monitor Realtime Database with Cloud Monitoring, you must set up a workspace for your project. A workspace organizes monitoring information from one or more projects. After setting up a workspace, you can create custom dashboards and alerting policies.
Open the Cloud Monitoring Page
If your project is already part of a workspace, the Cloud Monitoring Page opens. Otherwise, select a workspace for your project.
Select the New Workspace option or select an existing workspace.
Click Add. After your workspace builds, the Cloud Monitoring Page opens.
Create a dashboard and add a chart
Display the Realtime Database metrics collected from Cloud Monitoring in your own charts and dashboards.
Before you proceed, make sure your project is part of a Cloud Monitoring workspace.
In the Cloud Monitoring Page, open your workspace and go to the Dashboards page.
Click Create Dashboard and enter a dashboard name.
In the upper-right hand corner, click Add Chart.
In the Add Chart window, enter a chart title. Click the Metric tab.
In the Find resource type and metric field, enter Firebase Realtime Database. From the auto-populated dropdown, select one of the Realtime Database metrics..
To add more metrics to the same chart, click Add Metric and repeat the previous step.
Optionally, tailor your chart as needed. For example, in the Filter field, click + Add a filter. Scroll down, then select a value or range for the metric of interest you wish to filter the chart on.
Click Save.
For more on Cloud Monitoring charts, see Working with charts.
Create an alerting policy
You can create an alerting policy based on the Realtime Database metrics. Follow the steps below can create an alerting policy that emails you whenever a specific Realtime Database metric meets a certain threshold.
Before you proceed, make sure your project is part of a Cloud Monitoring workspace.
In the Cloud Monitoring Page, open your workspace, and go to the Alerting page.
Click Create Policy.
Enter a name for your alerting policy.
Add an alerting condition based on one of the Realtime Database metrics. Click Add Condition.
Select a Target. In the Find resource type and metric field, enter Realtime Database. From the auto-populated dropdown, select one of the Realtime Database metrics.
Under Policy triggers, use the dropdown fields to define your alerting condition.
Add a notification channel to your alerting policy. Under Notifications, Click Add Notification Channel. Select Email from the dropdown menu.
Enter your email in the Email address field. Click Add.
Optionally, fill out the documentation field to include additional information in your email notification.
Click Save.
If your Realtime Database usage exceeds the configured threshold, you will receive an email alert.
For more on alerting policies, see Introduction to alerting.