
As part of managing your Firebase projects, you'll want to review usage of Cloud Storage (for example, how many Bytes are being stored, how many download requests are coming from your apps).
To review your Cloud Storage billed usage, check the Usage and Billing dashboard.
For resource usage, both the Cloud Storage Usage tab in the Firebase console and the metrics available through Cloud Monitoring can help you monitor Cloud Storage usage. This kind of monitoring can help you spot potential problems in your app. Looking at your app's usage can also give you insight into your bill. Additionally, if something seems off, getting a clear picture of your Cloud Storage bucket's operations (for example, by monitoring evaluation of Cloud Storage Security Rules) can be a helpful for troubleshooting.
Firebase console
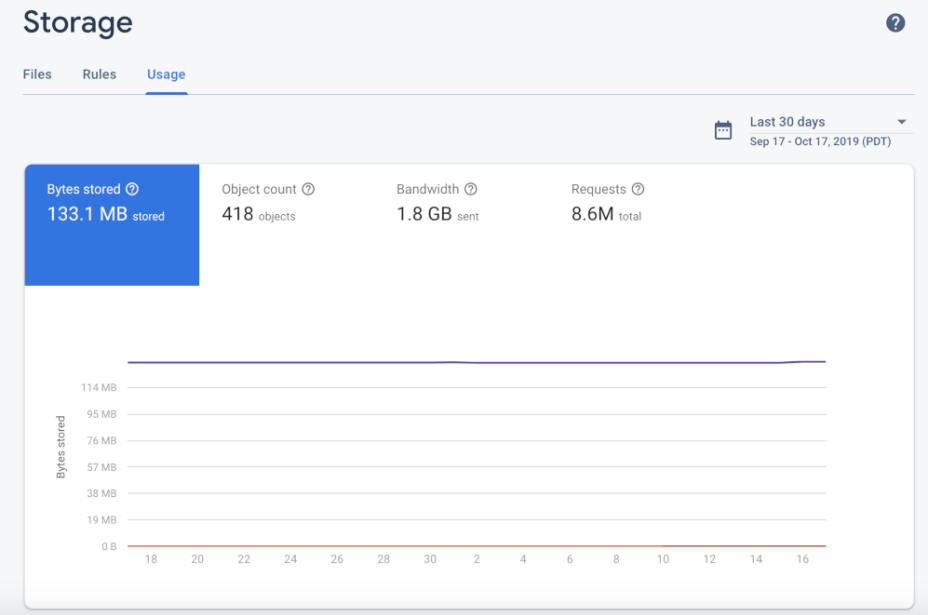
The Firebase console includes a usage dashboard that shows Storage Bytes stored, object count, bandwidth, and download requests over time. Storage metrics (Bytes stored and object count) are updated within 24 hours. Usage metrics (bandwidth and download requests) are updated every few hours.
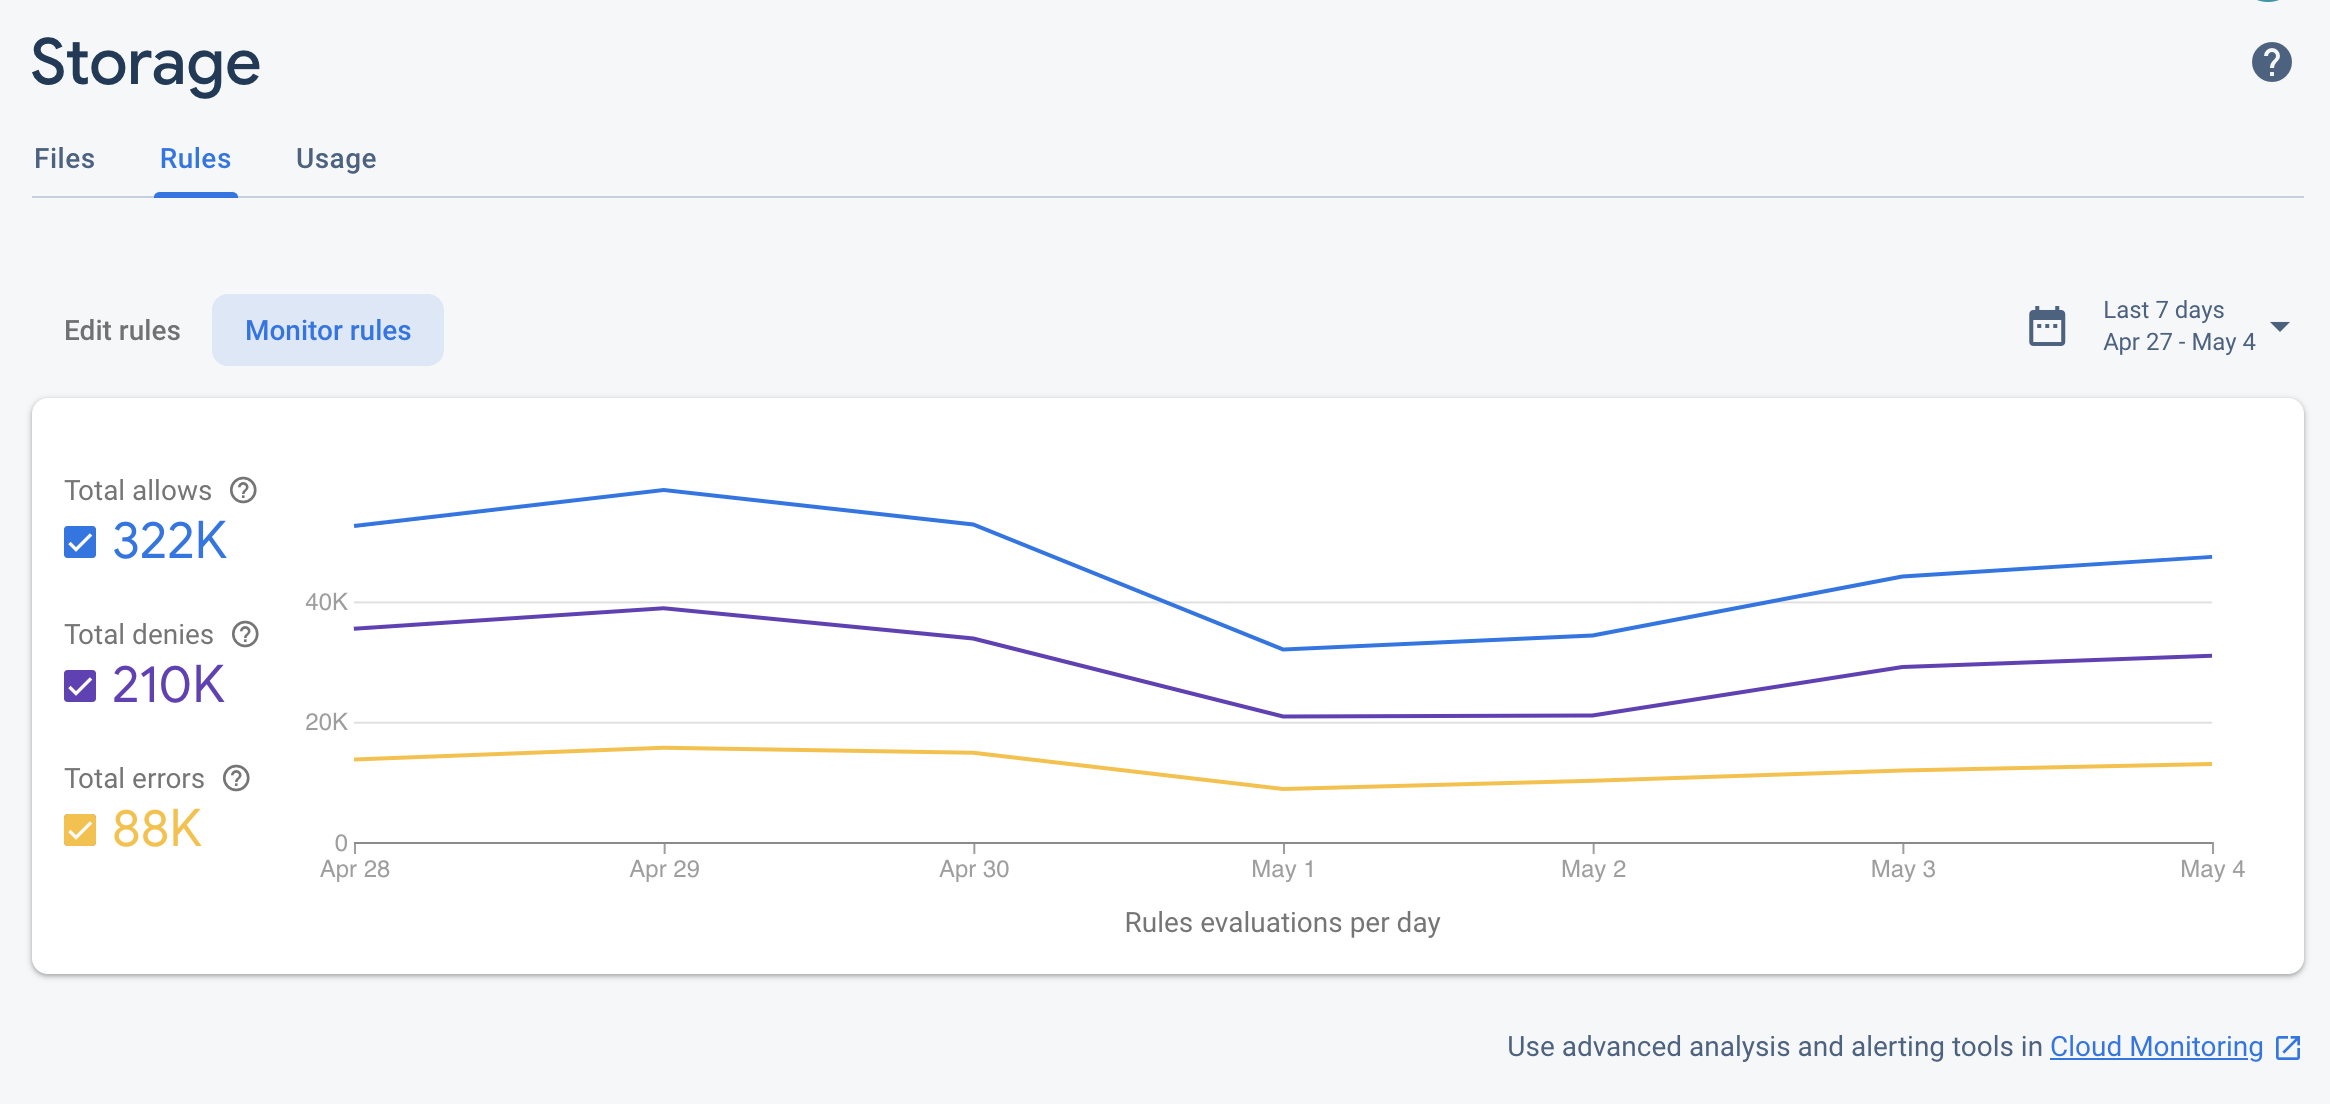
Additionally, the Firebase console provides a Firebase Security Rules evaluation dashboard, a useful, at-a-glance view of rules invocations. You can also monitor Firebase Security Rules usage through Cloud Monitoring. This provides the same rule evaluation metrics, along with the ability to build custom dashboards, analyze trends, and configure alerts (for example, when denied requests spike). See the Cloud Monitoring metrics reference for the complete list of available metrics.
Google Cloud console
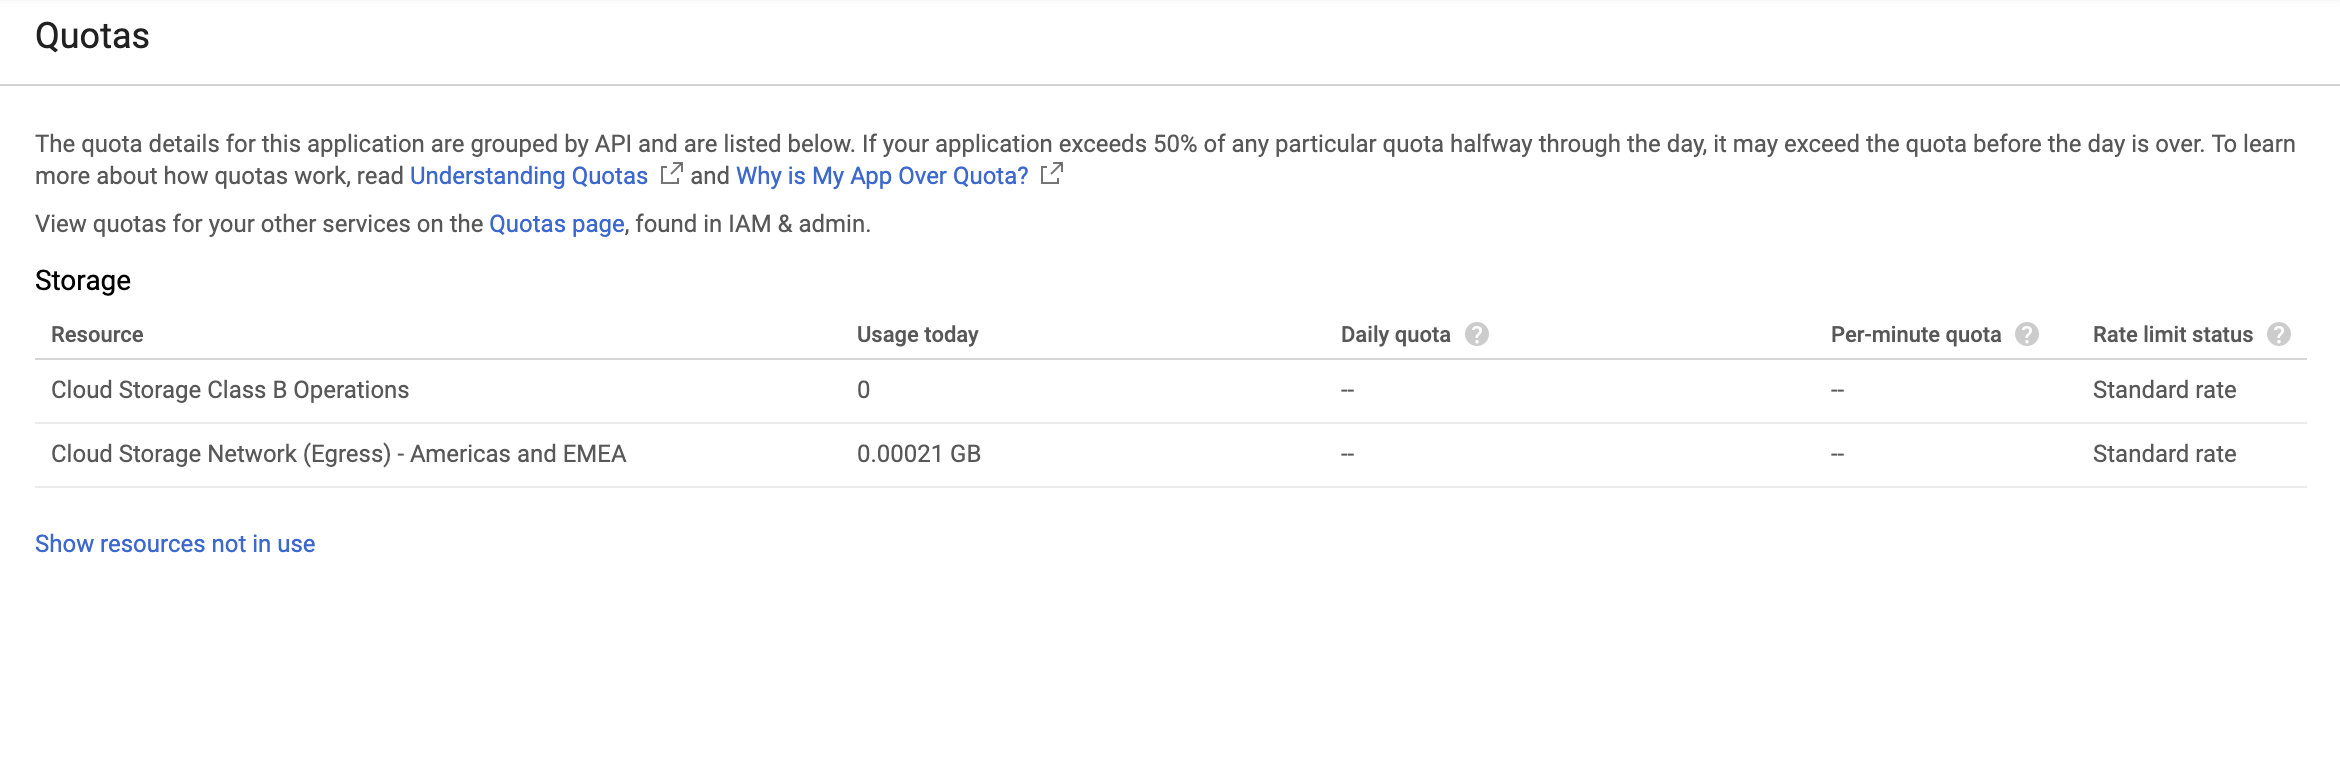
Since a Firebase project is just a Google Cloud project with Firebase services and configurations added, you can view your buckets and data in the Cloud Storage section of the Google Cloud console.
Monitor legacy buckets in App Engine
If you have a legacy *.appspot.com
Cloud Monitoring
Cloud Monitoring collects metrics, events, and metadata from Google Cloud products that you can use to create dashboards, charts, and alerts. Cloud Monitoring includes the following Security Rules-related Cloud Storage metrics:
| Metric Name | Description |
|---|---|
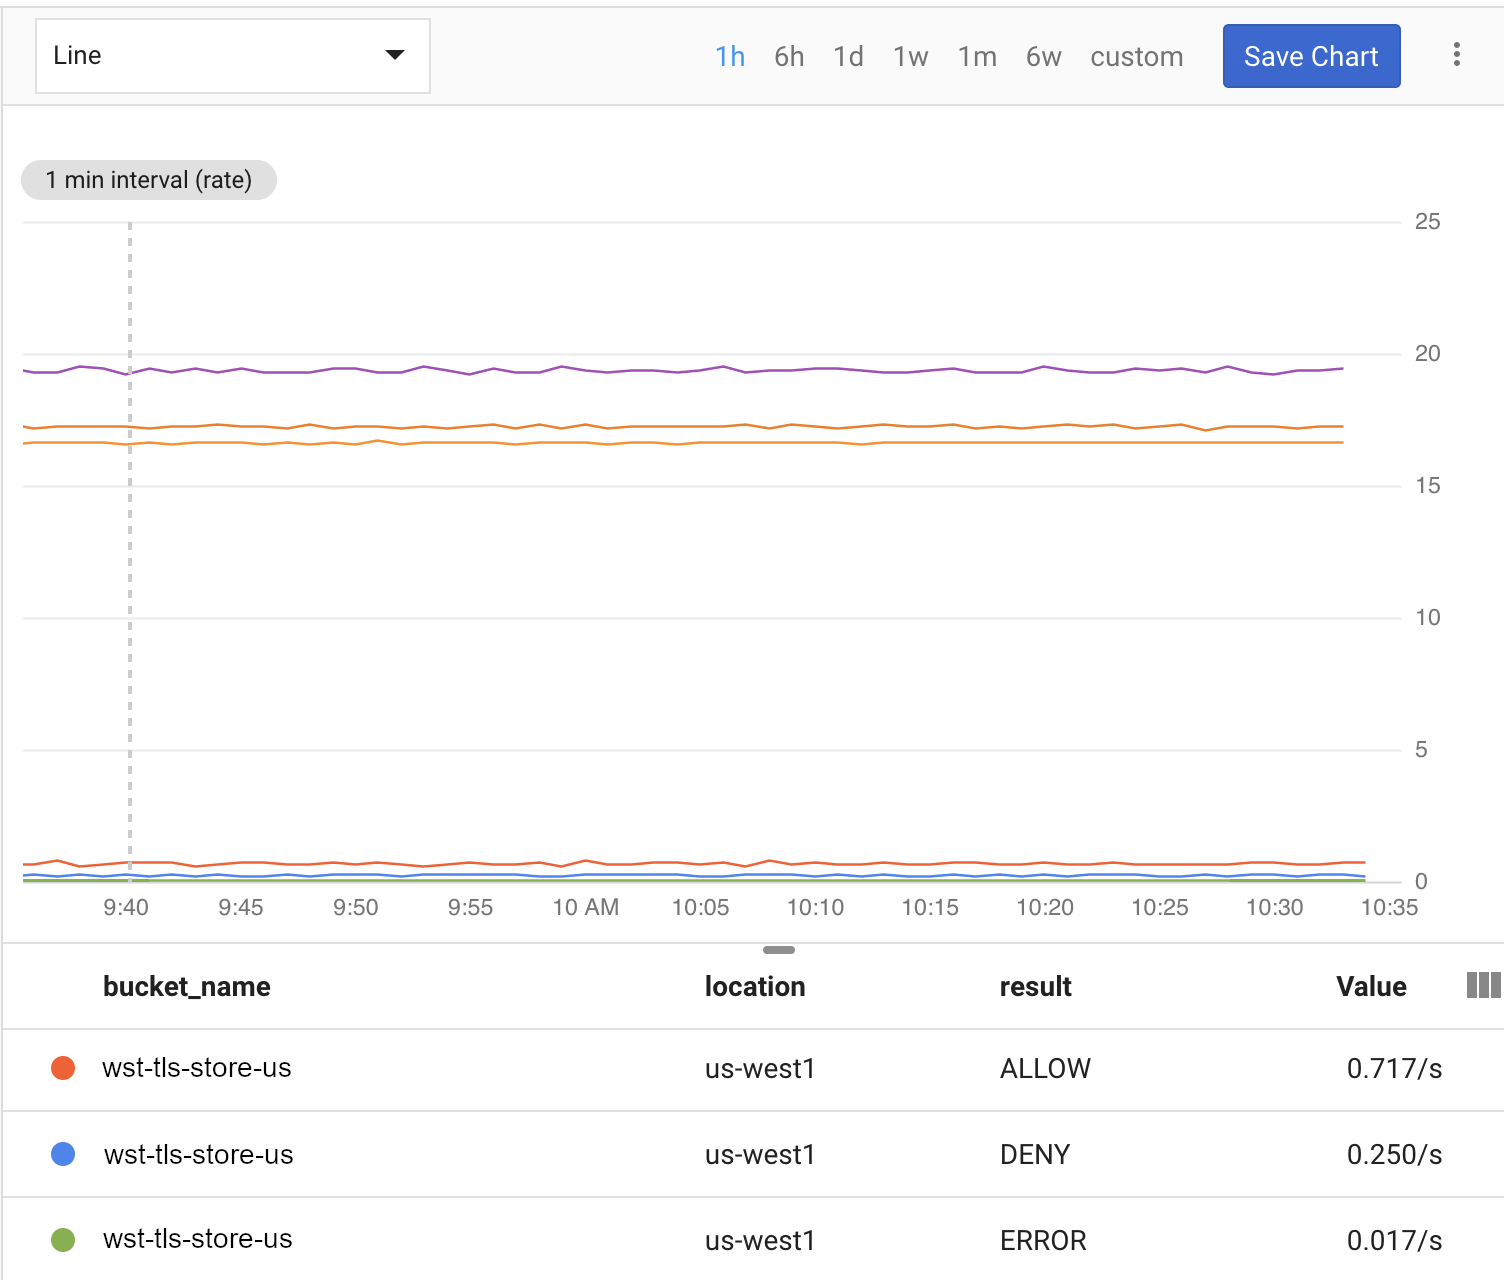
| Rule evaluations | The number of Cloud Storage Security Rules evaluations performed in response to write or read requests. You can break this metric down by the result of the request (ALLOW, DENY, or ERROR) or the bucket name. |
- Sampling rate
- The Cloud Storage metrics are sampled every 60 seconds, but updates may take up to 4 minutes to show up in your dashboards.
Using these metrics, you can set up a Cloud Storage dashboard like the following:
Complete the steps below to start monitoring Cloud Storage with Cloud Monitoring.
Create a Cloud Monitoring workspace
To monitor Firebase with Cloud Monitoring, you must set up a workspace for your project. A workspace organizes monitoring information from one or more projects. After setting up a workspace, you can create custom dashboards and alerting policies.
Open the Cloud Monitoring Page
If your project is already part of a workspace, the Cloud Monitoring Page opens. Otherwise, select a workspace for your project.
Select the New Workspace option or select an existing workspace.
Click Add. After your workspace builds, the Cloud Monitoring Page opens.
Create a dashboard and add a chart
Display the Firebase metrics collected from Cloud Monitoring in your own charts and dashboards.
Before you proceed, make sure your project is part of a Cloud Monitoring workspace.
In the Cloud Monitoring Page, open your workspace and go to the Dashboards page.
Click Create Dashboard and enter a dashboard name.
In the upper-right hand corner, click Add Chart.
In the Add Chart window, enter a chart title. Click the Metric tab.
In the Find resource type and metric field, enter Cloud Storage for Firebase. From the auto-populated dropdown, select one of the Cloud Storage metrics..
To add more metrics to the same chart, click Add Metric and repeat the previous step.
Optionally, tailor your chart as needed. For example, in the Filter field, click + Add a filter. Scroll down, then select a value or range for the metric of interest you wish to filter the chart on.
Click Save.
For more on Cloud Monitoring charts, see Working with charts.
Create an alerting policy
You can create an alerting policy based on the Firebase metrics. Follow the steps below can create an alerting policy that emails you whenever a specific Firebase metric meets a certain threshold.
Before you proceed, make sure your project is part of a Cloud Monitoring workspace.
In the Cloud Monitoring Page, open your workspace, and go to the Alerting page.
Click Create Policy.
Enter a name for your alerting policy.
Add an alerting condition based on one of the Firebase metrics. Click Add Condition.
Select a Target. In the Find resource type and metric field, enter Cloud Storage for Firebase. From the auto-populated dropdown, select one of the Cloud Storage metrics.
Under Policy triggers, use the dropdown fields to define your alerting condition.
Add a notification channel to your alerting policy. Under Notifications, Click Add Notification Channel. Select Email from the dropdown menu.
Enter your email in the Email address field. Click Add.
Optionally, fill out the documentation field to include additional information in your email notification.
Click Save.
If your Cloud Storage usage exceeds the configured threshold, you will receive an email alert.
For more on alerting policies, see Introduction to alerting.